Infrastructure & Automation
Metrics & Alerting
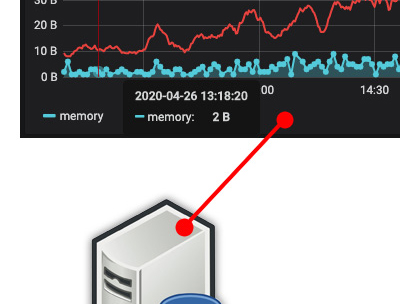
Some of my time at State Farm was spent creating and updating Grafana Dashboards. These dashboards display metrics that are scraped by various instances of Prometheus. I wrote a Python script that would search and update outdated PromQL statements.
I also developed an internal Python Django application and deployed it using Docker and Kubernetes. This site served as a "Front Door" for other teams to request infrastructure monitoring and for existing customers to update and create new Prometheus alerts by using a form, instead of manually pulling, updating and committing the alerting rules.
Technologies Used Docker, Grafana, Django, Python, Go, Docker, Kubernetes, Prometheus, Consul